Data Visualizations
Here is a collection of my data visualization projects. Mostly private projects I did as a civic hacker.

Chicago Housing Burden

Single Family Zoning
Inspired by an article from the New York Times I wanted to create the same map about Single Family zoning for San Diego.

How Americans Sleep

Child Care Cost Bay Area

Toronto High Rise Building inspection
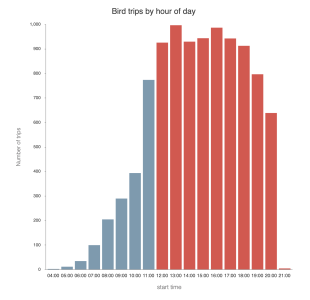
Louisville Bird data

Vision Zero Dashboard
Data Analysis and visualizations regarding traffic fatalities in the city of San Diego using Open Data.

State Budget Visualization
The finance ministry of the state of Rheinland-Pfalz in Germany wanted to increase transparency and publish their budget in a visually appealing way.

Code Enforement Violations San Diego

Child Care Support
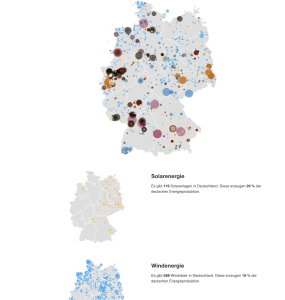
Energy Production germany
Inspired by the Washington Posts Energy production map for the United States, I found and cleaned the data for Germany and created a similar map for Germany.

Crime in San Diego
Failed Bank Tracker

Armsexport Map
In cooperation with the OKF and BICC I updated the interactive map from BICC to improve the readability and interactivity.