VizRisk Challenge: Audience
When I prepare a conference talk or a workshop, I am tailoring my talk or workshop to the expected audience. For example, I will add details about the country or city the conference is in. Adding pictures of the town, or in case of my workshops use data from that city to use as examples or exercises for the participants. Thinking about who is in the audience helps them to relate more to my talk/workshop and hopefully pay closer attention.
The same is true if you create a visualization. You need to think about who the audience of your visualization is. The first Step, when I’m tasks to create a visualization is to think about or ask the customer who the target audience for that visualization is.
Choosing an audience will help you keep on track
Choosing an audience will inform the questions you ask your data and the questions you try to answer in your exploratory analysis. It will help you keep on track and evaluate your findings.
When you get stuck, knowing who your audience is and maybe even evaluate or change your question to ask the data helps you.
Much of visualization design is about figuring out the audience (Nathan Yau)
You will most definitely refine your audience once you're in the exploratory analysis stage.
The more you know about your audience, the easier it is to design visualizations for it.
Monrovia City Corporation (MCC) is my target audience for VizRisk
For the VizRisk challenge, I choose Monrovia City Corporation (MCC) officials that want to improve the flood risk if their governing body. During my research, I found that Monrovia does not have an organized district administration; it is harder to find responsible governance bodies.
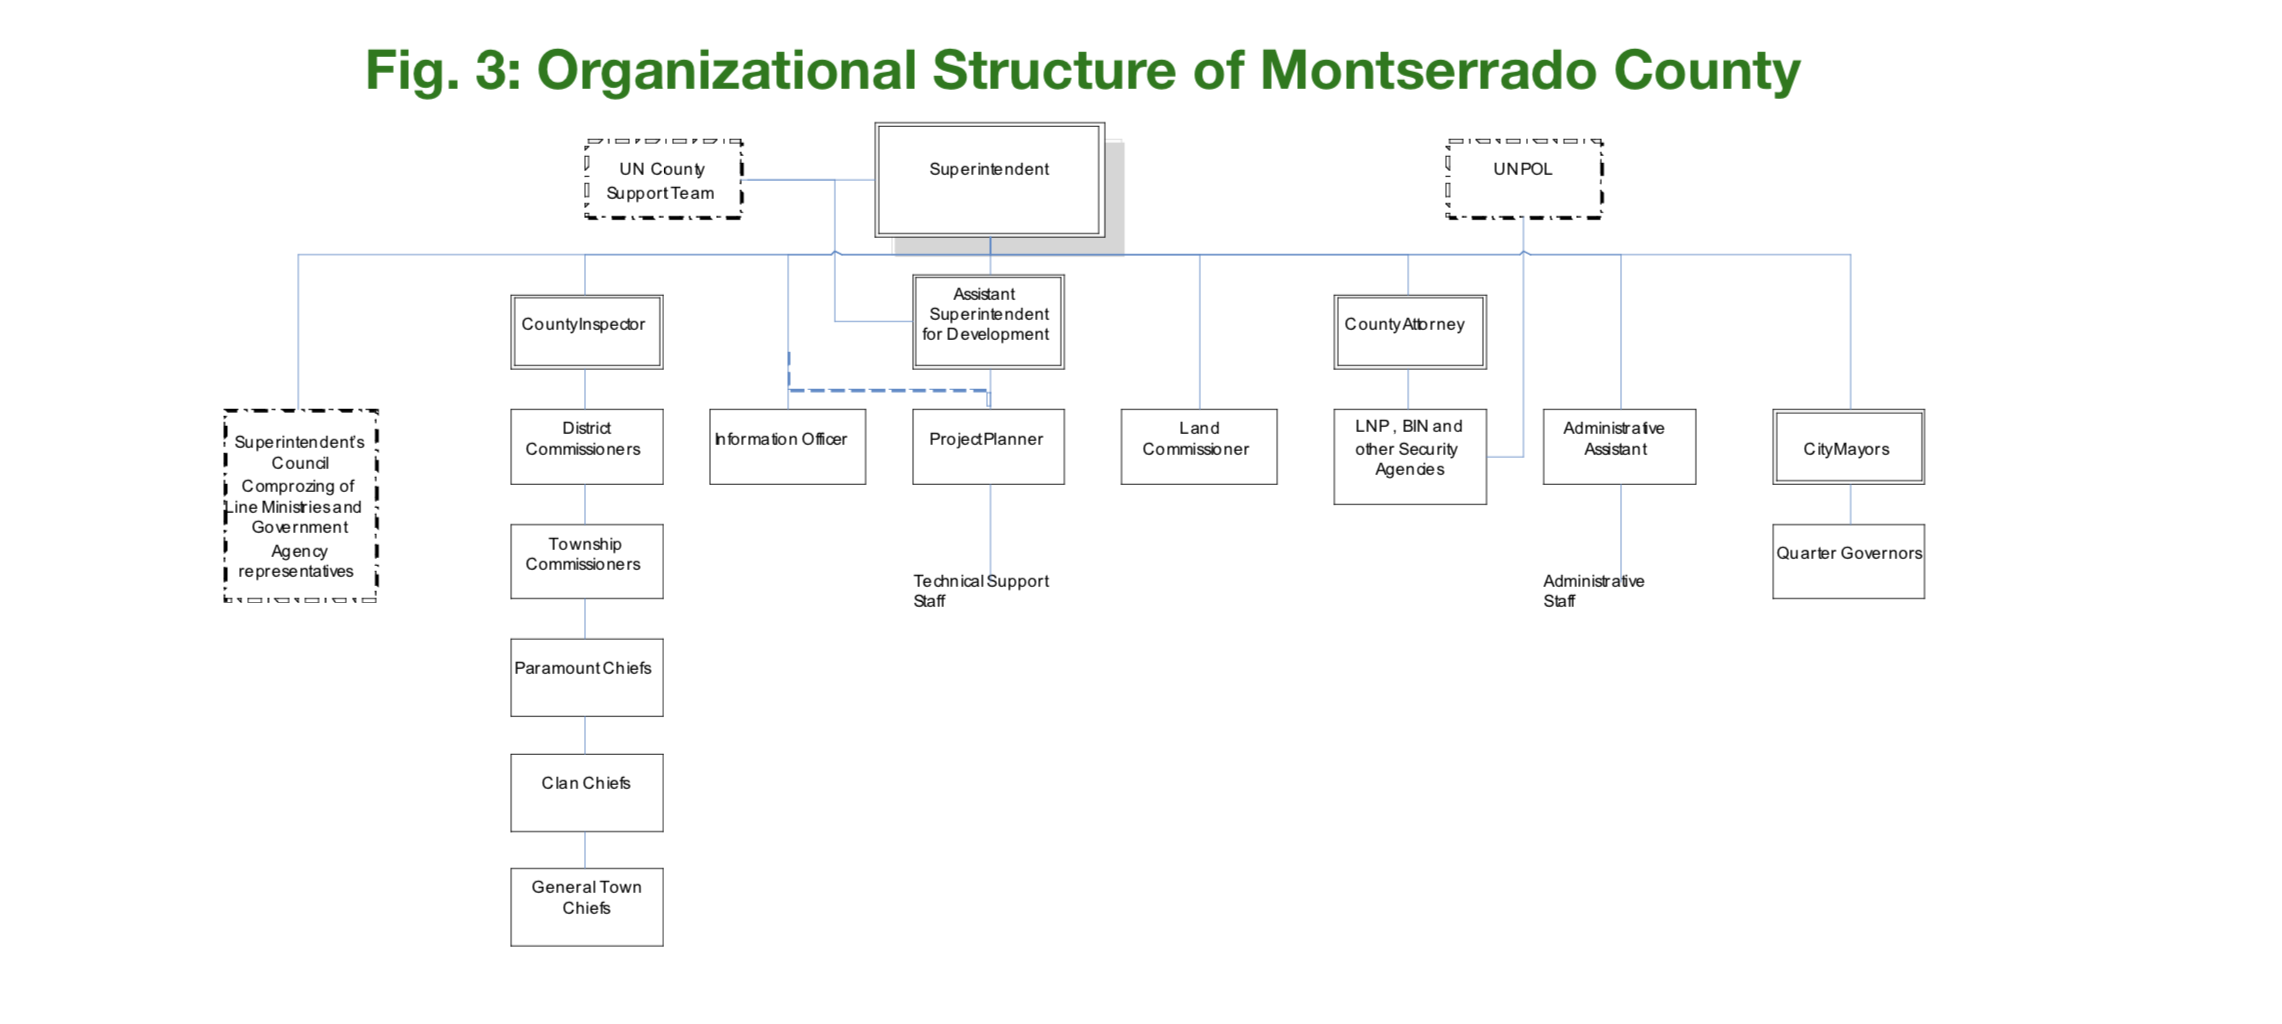
The research for the government structure of Monrovia and Liberia turned out to be a lot more complicated than I have imagined.
Monrovia is a district of the Montserrado County and only the county has a defined government as seen below.
Here are a few links about Monrovia and the structure that I could find:
https://www.emansion.gov.lr/doc/MontserradoCDA.pdf
https://en.wikipedia.org/wiki/Monrovia#cite_note-Development-20
http://www.eeas.europa.eu/archives/delegations/liberia/documents/projects/10edf_en.pdf
I need to validate my assumptions here with the GFDRR team.
They probably want to know what areas are at the highest risk, where do they need to focus on in the short-term and in the long-term. What (government) facilities are at risk.
Greater Monrovia is divided into 16 “zones”. Like clans, these zones are subdivided into 161 “communities”. Greater Monrovia does not have an organized district administration like other districts, with all lower-level local authorities being directly supervised by the Montserrado County Superintendent.
Municipally, Greater Monrovia District is subdivided into two city corporations and ten other local authorities (nine townships and one borough). Established by law in 1973 and operational since 1976, the Monrovia City Corporation (MCC) is responsible for the city's administration. The MCC also provides services to the townships and borough through a revenue-sharing arrangement, but has no zoning or enforcement jurisdiction in them.
I like to ask and answer a few questions about the audience, and the answers to these questions will inform my design and research along the way.
How Much Time Does a local government official have?
Like most government officials, they're short on time, and the result needs to communicate clearly. Showing big numbers, explaining graphs, highlighting essential areas, do not show too much detail, minimize the interactivity. These should all help reduce the time spent and still get the most insights.
What’s Monrovia's government official Data Visualization Familiarity Level?
I don't know yet, but probably not that high. That's why we need to show simple graphs/maps, don't get too fancy, use fewer animations, highlight critical components.
What’s the familiarity level with flood maps?
I don't know yet. I don't know the audience well enough. I need to either research more, ask the VizRisk challenge team (going to do it :) ) or talk to the audience.
How will the charts add value for a government official?
Charts can help government officials make more informed decisions about where to focus their effort on flood prevention and risk assessment. If I can design these charts to be easy to read and understand, I can help them make better decisions.
What response do I want to invoke through the visualization?
I want to help them identify specific areas to focus their attention in the short term, but give them guidance for the long-term as well. This is still fuzzy and will be refined once I start digging deeper into the data.
What challenges do government officials in Monrovia face when it comes to floods and what roadblocks prevent them from overcoming those challenges?
The answer to these questions is essential but still unknown to me. I will do more research and update the answer.
Why do I choose this audience?
I think that the highest impact can be achieved targeting government officials to help them understand which areas and therefore which population is at the highest risk and where they can make the most impact with decisions they make.
I want to help them identify specific areas to focus their attention in the short term, but give them guidance for the long-term as well.
You want to relate back to your audience when you analyze the data for the first time.
While doing the exploratory analysis, you want to relate back to your audience and think about the questions they might have for the data. I formulated a few already, so here is my first initial list of questions I want to ask the data.
Next Steps is to find more data
The next step after I have my audience and already a few starting questions are to evaluate if I have enough data already or if I need to look for additional datasets I can use to answer these questions.